7 Root Cause Analysis Tools Demystified: Applications in Quality Improvement 7 Root Cause Analysis Tools Demystified: Applications in Quality Improvement
- February 22, 2024
- Posted by: bhushanpungliya
- Categories:

Root cause analysis is an indispensable practice in problem-solving across various industries. To tackle complex issues effectively, understanding and employing the right tools is paramount. Here, we delve into seven powerful tools utilized in root cause analysis, each offering unique perspectives and methodologies.
Absolutely, diving into root cause analysis tools can greatly enhance problem-solving in various industries. Let’s break down each tool to highlight its significance and application:
1. Ishikawa Fishbone Diagram:
- Purpose: It visualizes the potential causes of a problem, categorizing them into branches akin to a fishbone.
- Application: Effective for identifying multiple causes across different categories, fostering team collaboration to address complex issues comprehensively.

2. Pareto Chart:
- Purpose: Illustrates the 80/20 principle, showcasing that a majority of effects come from a minority of causes.
- Application: Prioritizes issues by identifying and focusing efforts on the most significant factors contributing to a problem.

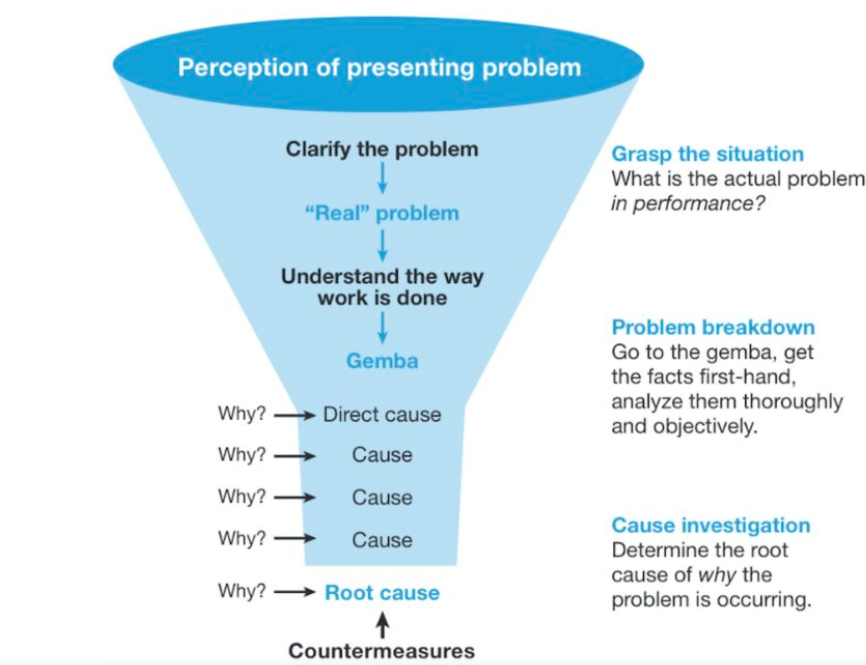
3. Five Whys:
- Purpose: Iteratively asks “why” to uncover deeper layers of causation behind a problem.
- Application: Helps reach the root cause by continuously probing and addressing the underlying reasons rather than surface-level symptoms.

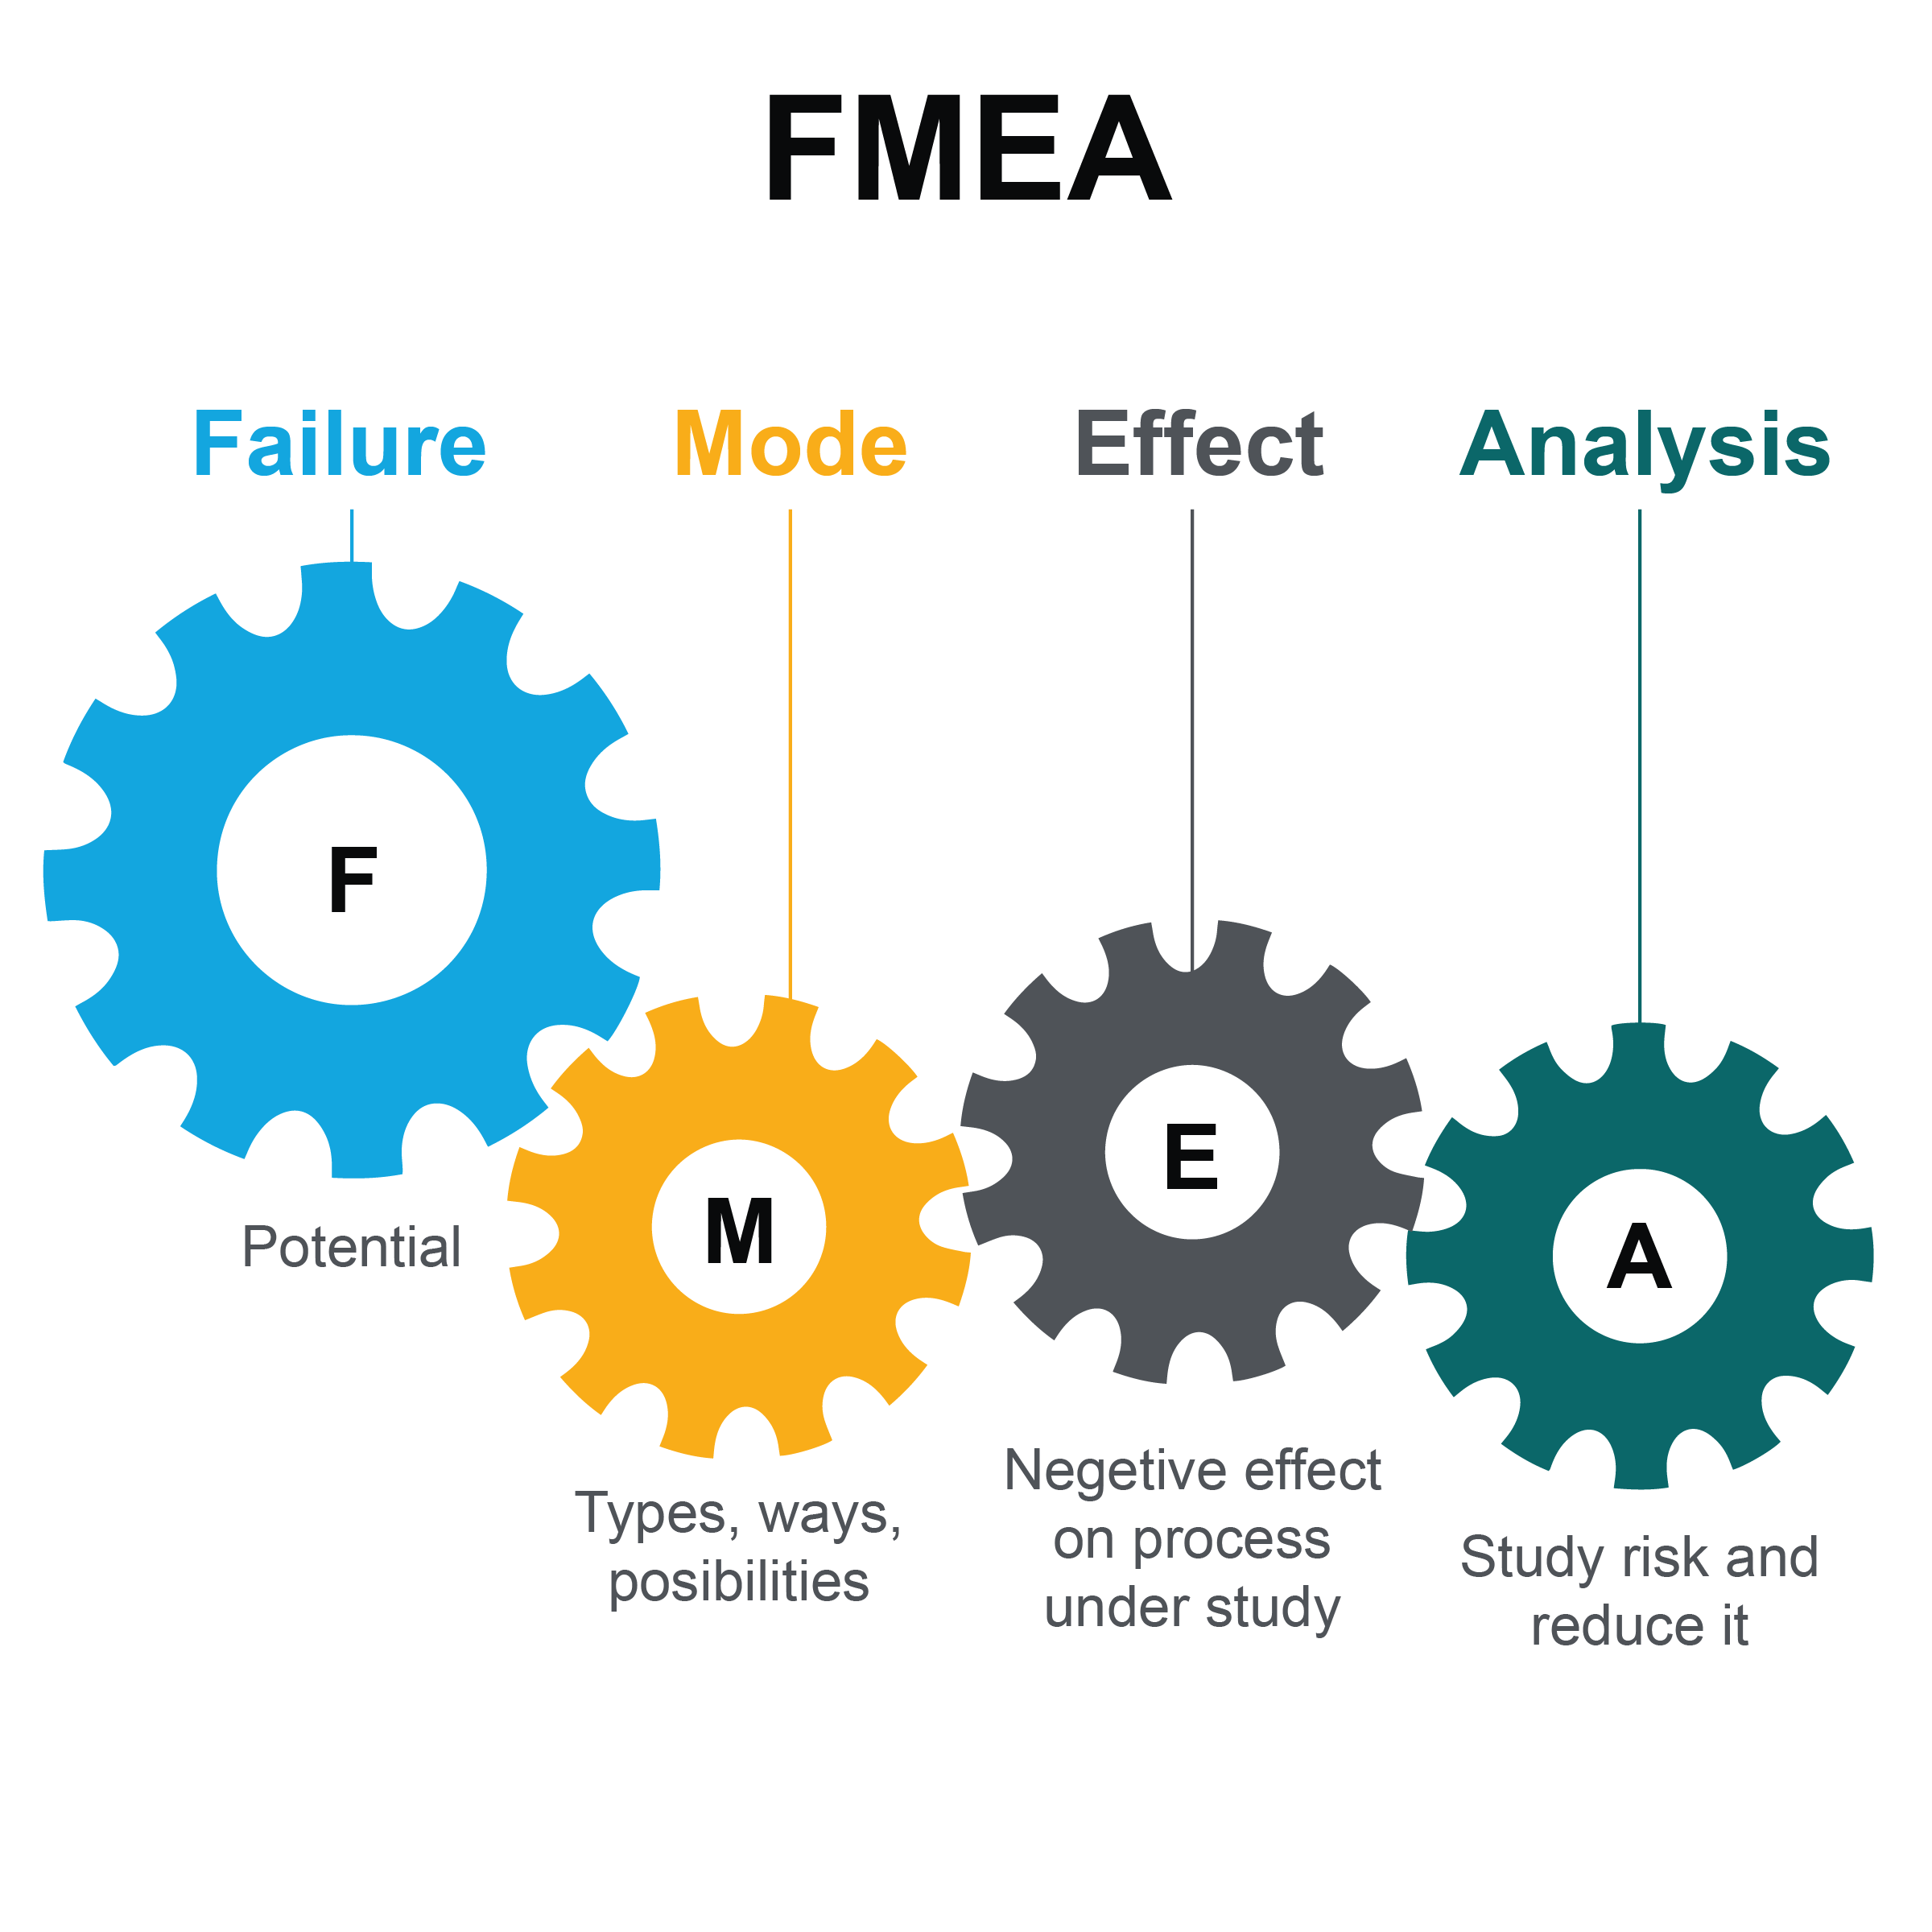
4. Failure Mode and Effect Analysis (FMEA):
- Purpose: Systematically anticipates potential failures, their causes, and their impacts.
- Application: Proactively identifies and mitigates risks by evaluating failure possibilities across processes, improving reliability and safety.

5. Scatter Diagram:
- Purpose: Displays relationships between two variables to identify patterns or correlations.
- Application: Useful for recognizing connections between factors, aiding in understanding cause-and-effect relationships.

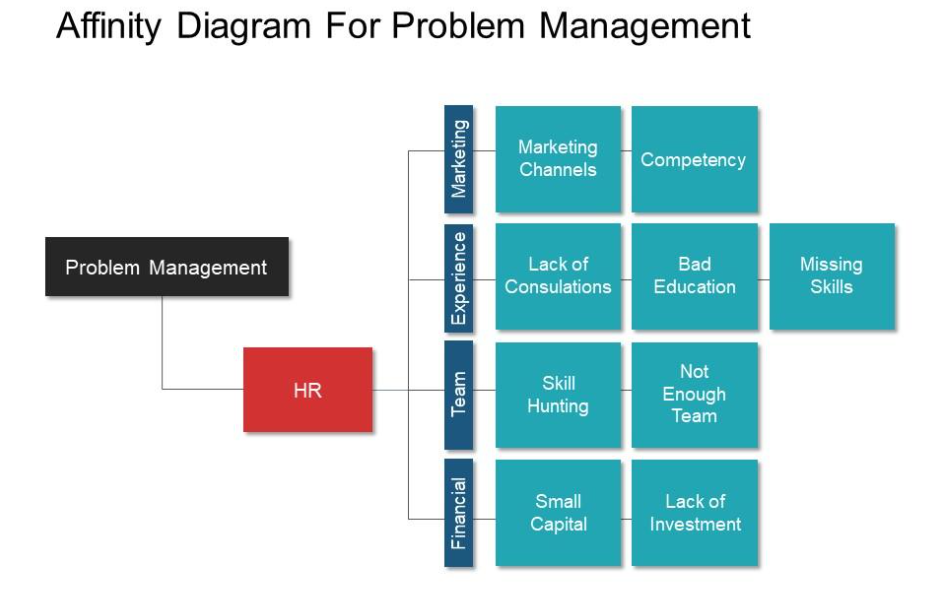
6. Affinity Diagram:
- Purpose: Organizes and categorizes large amounts of information or ideas into related groups.
- Application: Encourages brainstorming and organizes diverse ideas into meaningful clusters, facilitating structured problem-solving discussions.

- Purpose: Organizes and categorizes large amounts of information or ideas into related groups.
- Application: Encourages brainstorming and organizes diverse ideas into meaningful clusters, facilitating structured problem-solving discussions.
7. Fault Tree Analysis:

- Purpose: Represents the logical relationship between potential causes and a specific undesirable event.
- Application: Particularly valuable in high-risk industries like aerospace or nuclear power, allowing for a detailed examination of potential failures and their interdependencies.
Impact on Indian Business:
1. Operational Efficiency:
- Indian businesses, spanning manufacturing, IT, healthcare, and more, benefit from improved efficiency by pinpointing and resolving core issues affecting their operations. Tools like Pareto Charts and Fishbone Diagrams aid in streamlining processes and reducing waste.
2. Quality Improvement:
- Root cause analysis tools assist in identifying and addressing quality-related issues. Sectors like pharmaceuticals, automotive, and technology rely on these tools to enhance product quality, ensuring compliance with international standards.
3. Risk Mitigation:
- Indian industries, including banking, finance, and energy, utilize these tools to proactively identify risks. Techniques like Failure Mode and Effect Analysis (FMEA) help in mitigating risks and ensuring resilience against potential failures.
4. Innovation and Problem-Solving Culture:
- Implementing root cause analysis fosters a culture of innovation and continuous improvement. This is particularly beneficial for India’s growing startup ecosystem, encouraging problem-solving mindsets and agile methodologies.
5. Healthcare and Pharmaceuticals:
- India’s healthcare and pharmaceutical sectors leverage these tools to enhance patient care, optimize processes, and ensure drug safety and efficacy. Root cause analysis aids in reducing medical errors and improving treatment outcomes.
6. Supply Chain Optimization:
- Industries such as retail, logistics, and manufacturing benefit from identifying and rectifying supply chain inefficiencies. These tools help in minimizing disruptions and optimizing inventory management.
7. Regulatory Compliance:
- Compliance is crucial across industries. Root cause analysis tools assist Indian businesses in meeting regulatory standards by addressing underlying issues that might lead to non-compliance.
8. Customer Satisfaction:
- Understanding and resolving root causes of customer complaints or dissatisfaction is vital. These tools help in identifying systemic issues, leading to improved products and services, thus enhancing customer satisfaction and retention.
9. Data-Driven Decision-Making:
- Indian businesses are increasingly relying on data-driven insights. Root cause analysis tools provide a structured approach, allowing for informed decision-making based on thorough analysis rather than intuition.
10. Cost Reduction and Resource Optimization:
- By identifying and addressing root causes of inefficiencies, Indian businesses can significantly reduce operational costs and optimize resource utilization, contributing to overall profitability.
In essence, the impact of root cause analysis tools on Indian businesses is multi-faceted. They play a pivotal role in driving efficiency, quality, innovation, compliance, and customer satisfaction, contributing to the growth and success of diverse sectors within India’s vibrant economy.
Approaches to employ root cause analysis tools:
1. Cross-Functional Team Collaboration:
- Why?: Diverse perspectives can uncover different angles of a problem.
- How?: Bring together individuals from various departments or disciplines to contribute their expertise and insights during analysis sessions.
2. Clear Problem Definition:
- Why?: Precise problem definition ensures focused analysis.
- How?: Define the problem statement clearly to guide the analysis process and prevent veering off-track.
3. Sequential Methodologies:
- Why?: Systematic steps ensure comprehensive analysis.
- How?: Follow a structured sequence using tools like the Five Whys, Pareto Chart, and Fishbone Diagram to gradually drill down to root causes.
4. Data-Driven Analysis:
- Why?: Objective data supports accurate conclusions.
- How?: Gather relevant data and evidence to substantiate hypotheses or identify correlations, using tools like Scatter Diagrams to visualize relationships.
5. Prioritization of Causes:
- Why?: Focusing efforts on critical causes saves time and resources.
- How?: Utilize Pareto Charts to identify the most significant causes that warrant immediate attention.
6. Action-Oriented Solutions:
- Why?: Solutions should address identified root causes.
- How?: Develop action plans specifically targeting root causes identified through analysis, ensuring they are feasible and impactful.
7. Periodic Review and Iteration:
- Why?: Continuous improvement requires reassessment.
- How?: Regularly review the effectiveness of implemented solutions, iterate on approaches if necessary, and incorporate lessons learned into future analyses.
8. Documentation and Knowledge Sharing:
- Why?: Preserve insights and lessons learned for future reference.
- How?: Document the analysis process, findings, and implemented solutions to create a knowledge repository accessible to relevant stakeholders.
9. Training and Skill Development:
- Why?: Competency in using tools enhances their effectiveness.
- How?: Provide training and resources to teams to ensure proficiency in applying root cause analysis tools.
10. Leadership Support and Commitment:
- Why?: Endorsement from leadership promotes a culture of problem-solving.
- How?: Secure support and commitment from organizational leaders to prioritize and endorse the use of root cause analysis methodologies.
Combining these approaches creates a robust framework for conducting root cause analysis, fostering a culture of continuous improvement and problem-solving within an organization.
Conclusion:
By leveraging tools like Ishikawa Fishbone Diagrams, Pareto Charts, and Failure Mode and Effect Analysis (FMEA), Indian industries can identify and address core issues impacting operations, quality, and customer satisfaction. This not only enhances the overall efficiency but also contributes to a culture of continuous improvement.
The impact spans diverse sectors, from healthcare and pharmaceuticals to manufacturing, finance, and technology. Indian businesses can enhance operational efficiency, mitigate risks, comply with regulations, and drive innovation through a more data-driven and problem-solving-oriented approach.
Moreover, these tools not only address immediate concerns but also empower organizations to proactively anticipate and prevent future challenges. By fostering a culture that encourages cross-functional collaboration, data-driven decision-making, and a commitment to addressing root causes, Indian businesses can position themselves for sustained growth and success in an ever-evolving global landscape.
In essence, the integration of root cause analysis tools within Indian businesses signifies a commitment to excellence, efficiency, and continual advancement, paving the way for a more competitive and resilient business environment.
